We've designed a set of reports for each Group to help you understand more about what's happening with calls that are coming into your business. The idea here is to help you make more informed decisions around where you want to send your calls, and also how many people you may need in each Group!
Let's jump into how to see the reports, and what they all mean.
Getting to Group reports
- Login to our website here.
- Click on Reporting, then Group Reports.
- Click the report button of the Group that you're interested in.
If you want to look at a specific date range, use the date picker in the top right hand corner.
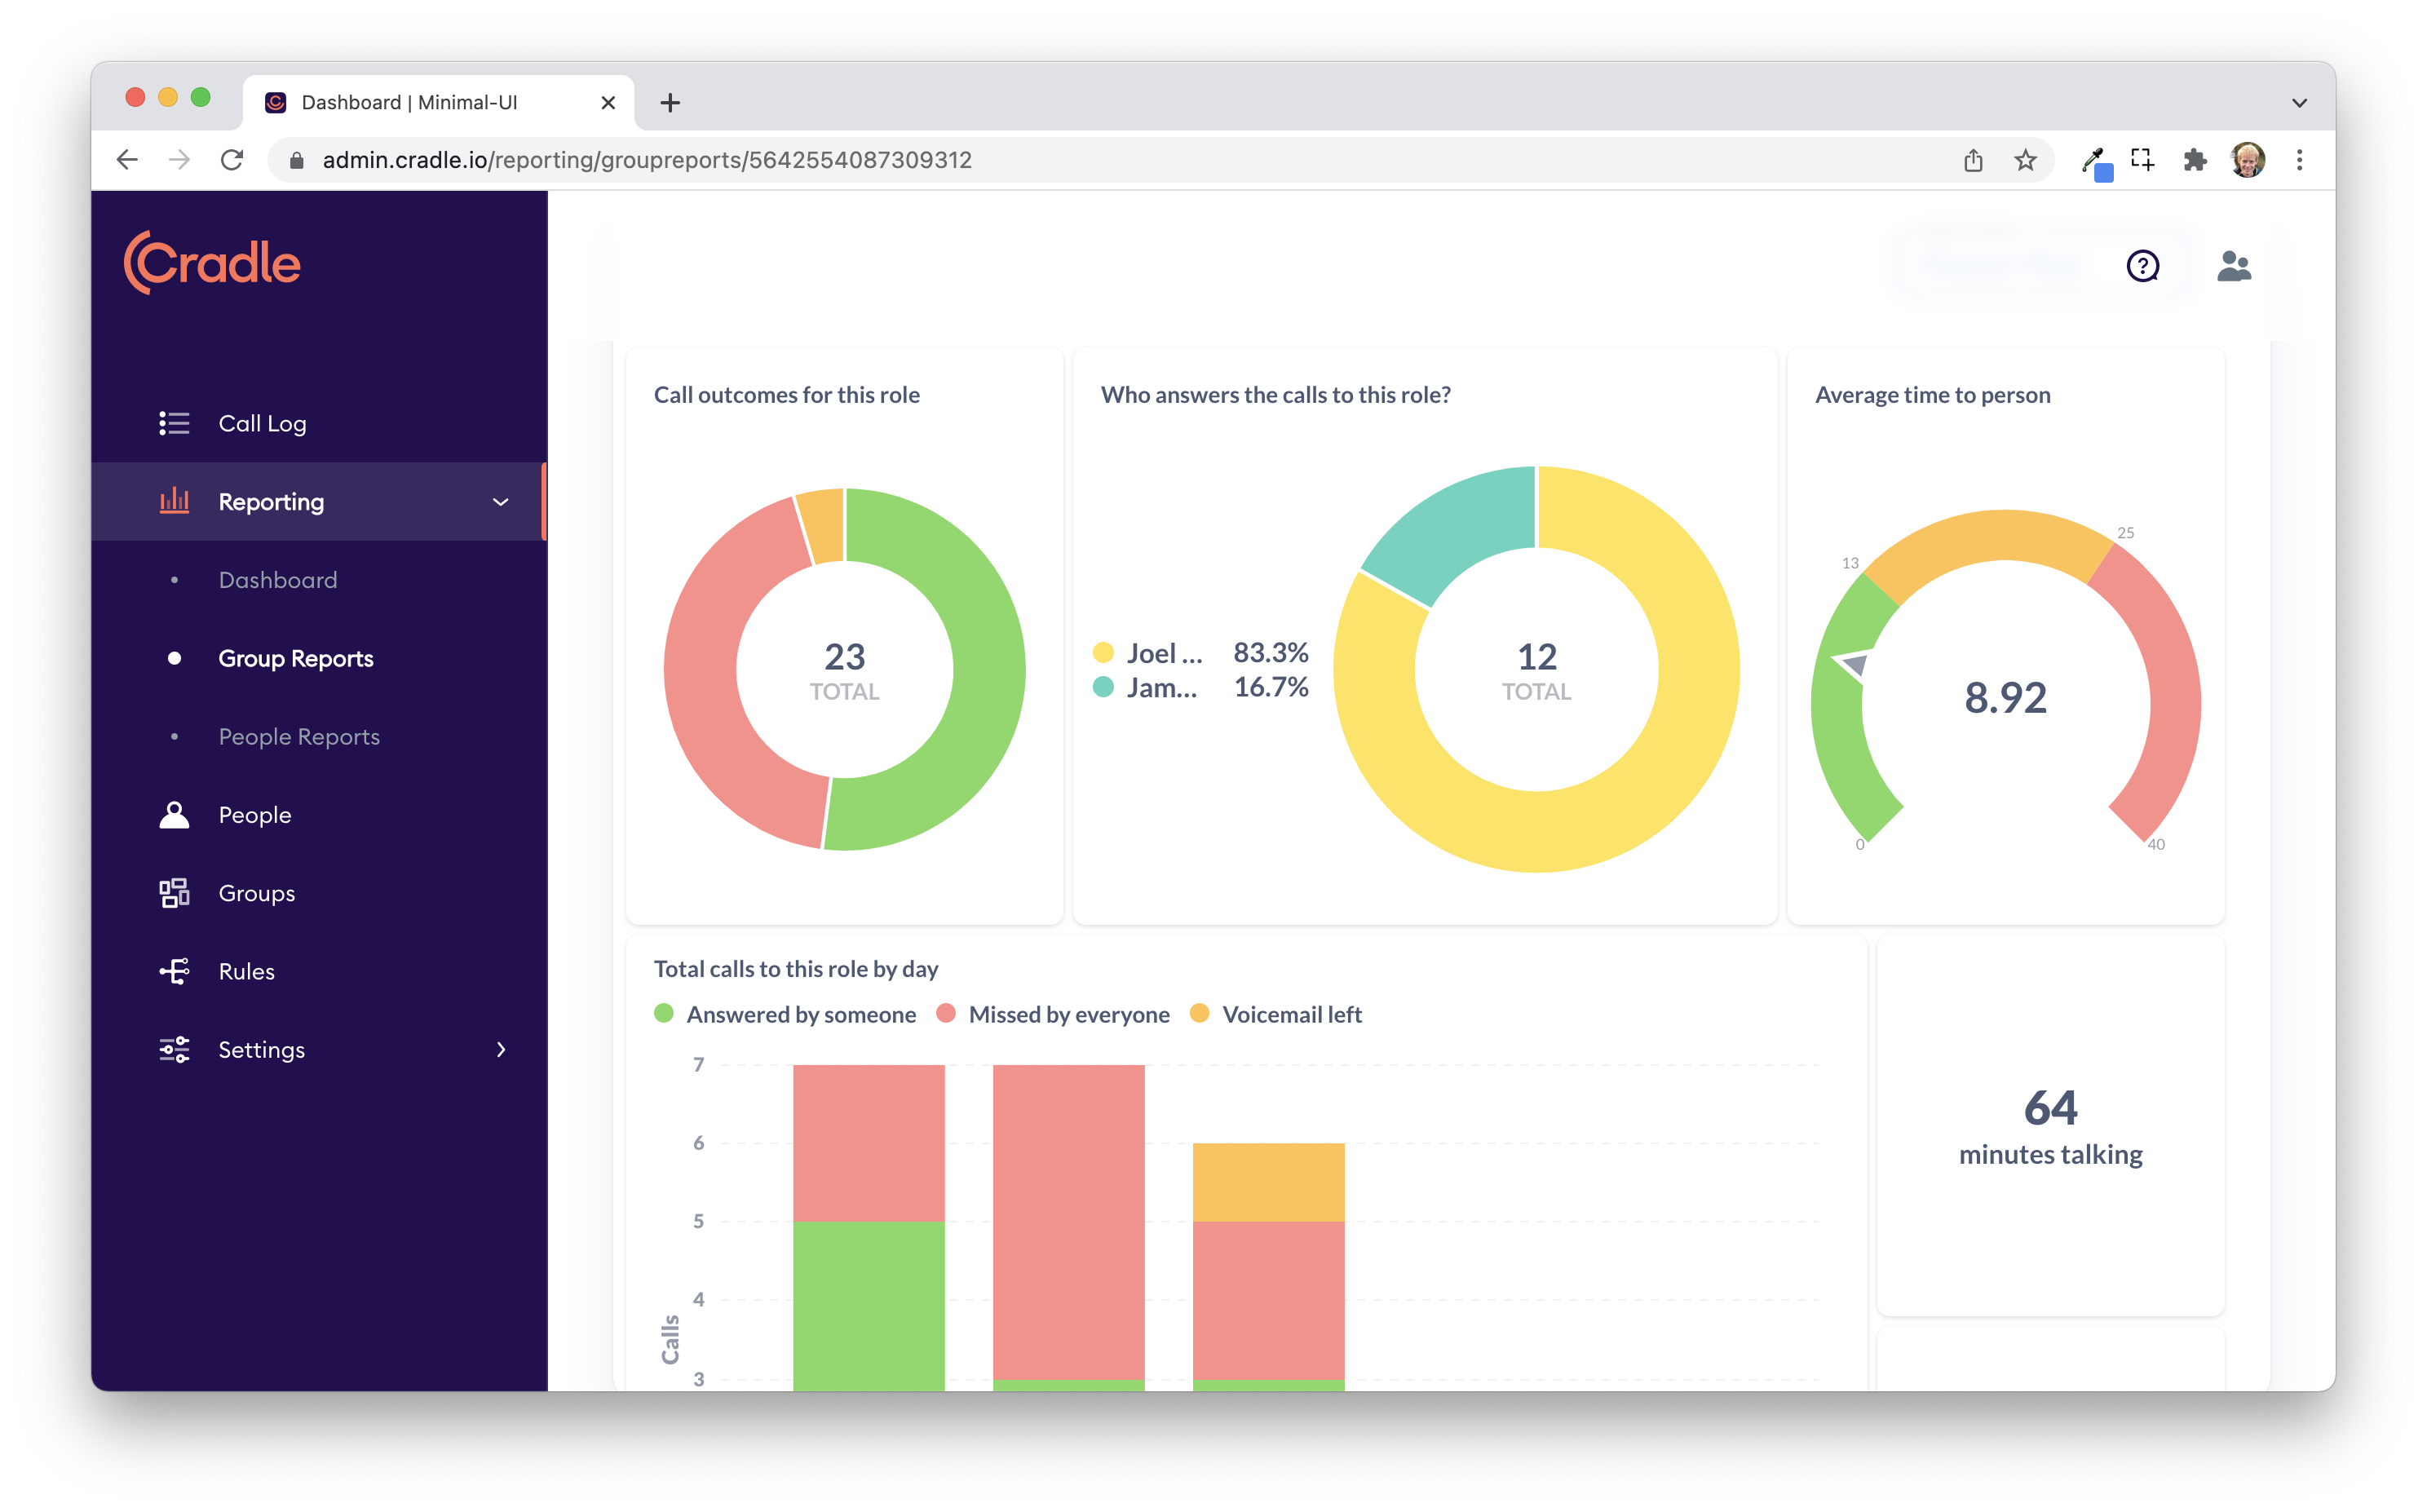
You'll then be presented with a bunch of tiles similar to the Dashboard. Each of these tiles represents a set of information. You can also mouse over each part of the tiles for more specific data. This information can be downloaded for further analysis by clicking the download button in the top right hand corner of any tile when mousing over it.
Each tile has its own tooltip, but here's a breakdown of each one.
Call outcomes
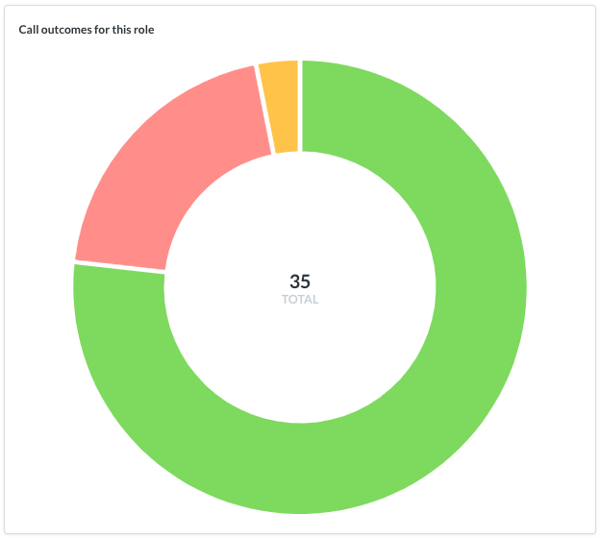
This tile represents how many calls have come into the Group over the selected date range, and what happened to them. You have answered by someone, missed by everyone and then voicemail (if the call was missed but the caller left a voicemail).
Call answers
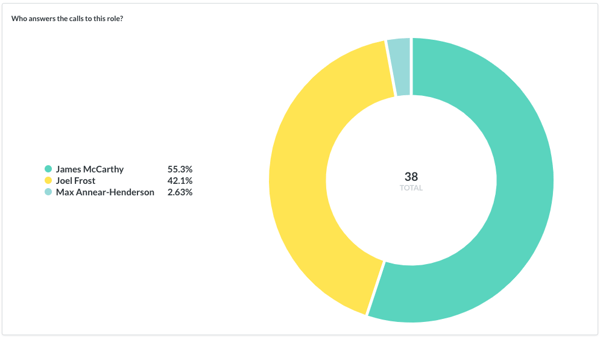
This tile represents, of the answered calls to the Group, how many calls each person is answering.
Average time to person
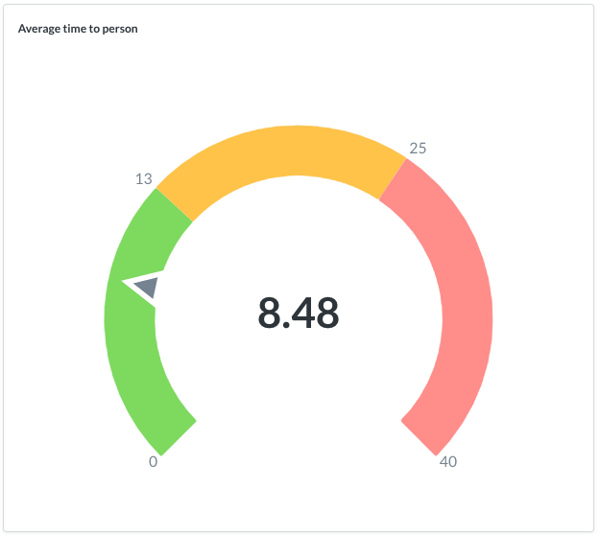
This tile shows how long people calling into this Group spend waiting to speak with someone in seconds. A ring is roughly 2.5s, just to give an idea. Keep in mind that this includes any voice menus that you have setup before a caller gets to the Group. From our experience, people prefer to spend about 25 seconds waiting before speaking to someone.
Group calls by day
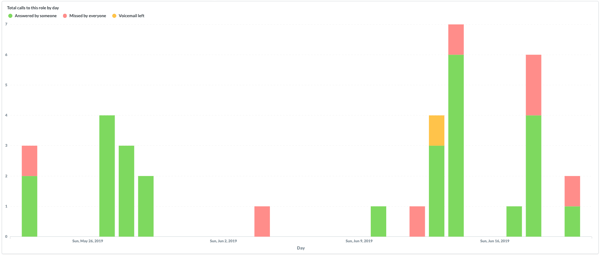
This tile shows the total number of calls to the group, but broken down into each day. Each bar represents a day and is broken down into what happened to each call on that day. You can use this to work out trends for calls to that group, and to highlight days that are busier than others.
Group calls by hour
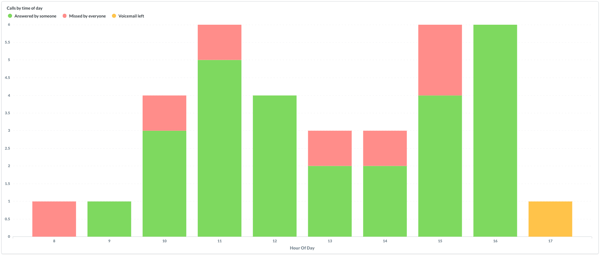
This tile shows the total number of calls to the group, but broken down hourly. Each bar represents an hour of the day, and what happened to each call. You can use this to work out which hours are busiest for calls to that group, and perhaps understand staffing requirements for that group.
Minutes talking
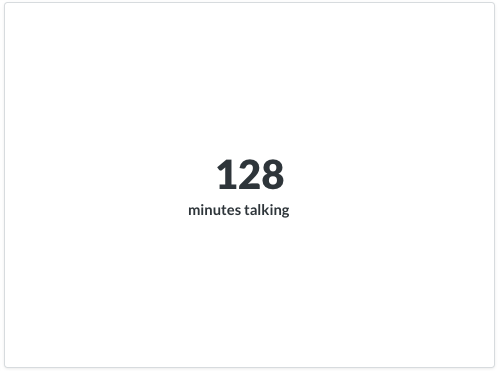
This tile shows, of the answered calls into the group, the total number of minutes spent talking. Keep in mind that this is only for inbound calls.
Seconds per call
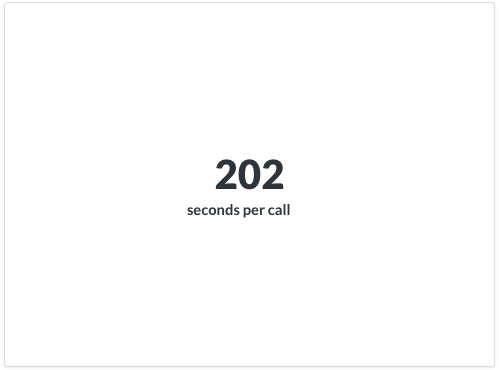
This tile shows, on average, the time spent on each call into the group. This is also only for inbound calls.
Blind transfers
This tile shows the number of calls that were originally to this group, but were then blind transferred out to another person even if the person is also in the group. Keep in mind that this data doesn't include warm transfers at this stage.
Unique callers
This tile shows the number of unique numbers that called into the group. You can use this to understand how many people are calling the group multiple times.
That about sums it up! Check this out for more information on setting your groups up.